EntepriseOne JdeAnalyzer
This software was created to analyze jdedebug.log produced by Peoplesoft/Oracle EnterpriseOne and help optimize business logic and SQL statements for better performance or possibly find bugs. JdeAnalyzer cannot optimize logic of your applications, reports and functions itself but can lead you to identify weaknesses of it. JdeAnalyzer must be used by a highly experienced developer who can analyze its results and suggest improvements.One of my customers wrote:
The analysis that has been done using the tool has helped to identify a number of serious problems with EnterpriseOne code. From experience we have already been made aware that run time issues can occur as a result of excessive / inefficient table access. By being able to identify the major sources of table I/O we have been able to quickly address the problem areas and derive substantial performance improvements in the system. This improvement goes beyond the specific program that had problems.
JdeAnalyzer offers the following:
 viewing the jdedebug.log
- you can view original jdedebug.log or optimized one (see below)
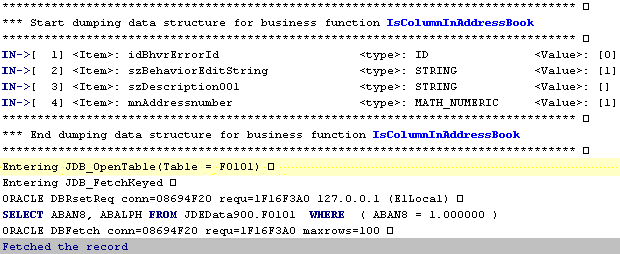
- application highlights the most important words (SQL statements, business functions etc.)
- application recognizes BSFN parameters changed by the business function and marks them red, also provides the original value passed into the function
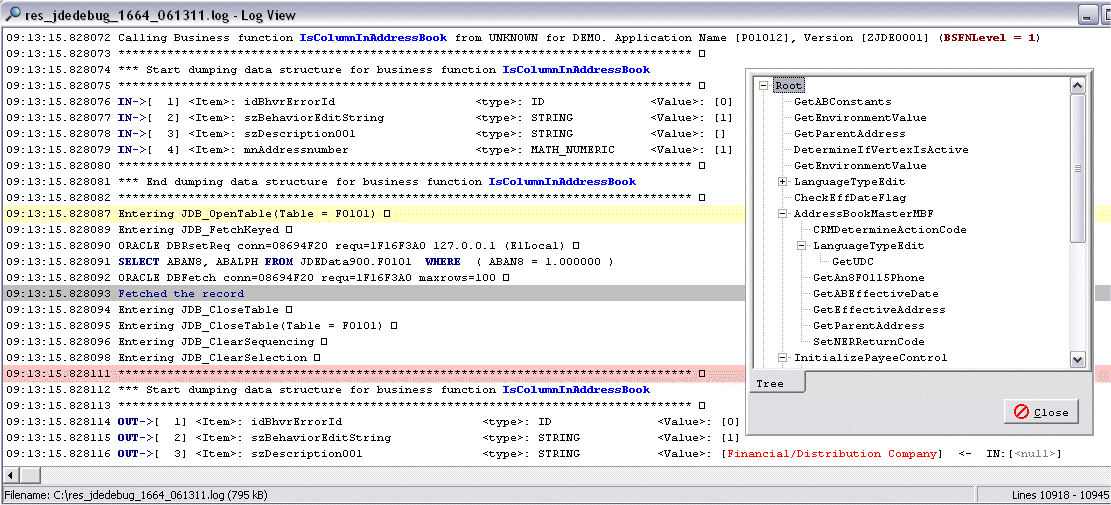
- application can show the complete list of business functions with their hierarchy, doubleclicking a function will show the appropriate part of the log
- it is possible to color some lines to find them easily later
- browsing large log already in 1 second (no waiting time!)
- efficient memory management (program does not load the whole log to the memory)
- see simple example on the rigth side or click it for more info
- generates optimized log
- processes jdedebug.log and creates another log that is significantly smaller and much easier to read
- based on setup you may omit useless lines or parts of information such as time, module, BSFN dumping etc.
- several more options provided
- analysis of BSFNs
- during processing of the log you can export all function calls or summary information or both
- summary information gives you overall picure of the time spent, number of calls, levels on which the function is called, list of called subfunctions and list of calling functions (on higher levels)
- you can also export only the list of functions having impact on performance
- example
- analysis of SQL statements
- during processing of the log you can also generate additional information about executed SQL statements (SELECTs/UPDATEs/INSERTs)
- exports number of executions, time spent in total, per call and as a percent of overall time spent
- exports number of successful/unsuccessful fetches
- exports list of functions from which the SQL statement was executed
- it is possible to export only SQL statements with impact on performance
- it is possible to ignore selects from system tables (these cannot be influenced by change of code)
- the information about SQL statements may be built on detail or summary level
- example
- extended table viewer
- similar to UTB but provides more options how to select and sequence the data
- your queries may be saved
- supports viewing of business views
Please contact David Macek to get more information.